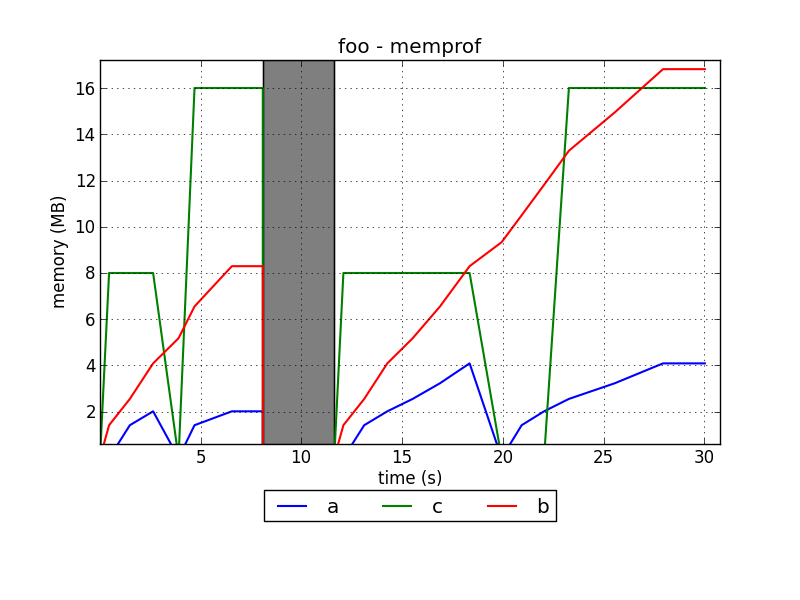
memprof logs and plots the memory usage of all the variables during the execution of the decorated methods.
Installation
Stable
sudo pip install --upgrade memprof
or
sudo easy_install --upgrade memprof
or (Debian testing/unstable)
sudo apt-get install python-memprof
Development
git clone git://github.com/jmdana/memprof.git
cd memprof
sudo python setup.py install
Usage
Using memprof is as easy as adding a decorator to the methods that you want to profile:
@memprof
def foo():
And importing the module just by including the line below at the beginning of your Python file:
from memprof import *
Now you can run as usual and logfiles with the names of your methods will be created (e.g. foo.log).
Generating plots
The logfiles are not very interesting so you might prefer to use the -p/--plot flag:
python -m memprof --plot <python_file>
python -m memprof -p <python_file>
Which, in addition to the logfile, will generate a plot (foo.png):

The grey bar indicates that the foo method wasn't running at that point.
The flag may also be passed as an argument to the decorator:
@memprof(plot = True)
Please keep in mind that the former takes precedence over the latter.
Adjusting the threshold
You may also want to specify a threshold. The value will be the minimum size for a variable to appear in the plot (but it will always appear in the logfile!). The default value is 1048576 (1 MB) but you can specify a different threshold (in bytes) with the -t/--threshold flag:
python -m memprof --threshold 1024 <python_file>
python -m memprof -t 1024 <python_file>
The threshold may also be passed as an argument to the decorator:
@memprof(threshold = 1024)
Please keep in mind that the former takes precedence over the latter.
mp_plot
If, after running memprof, you want to change the threshold and generate a new plot (or you forgot to use the -p/--plot flag with memprof), you don't have to re-run! Just call the command:
mp_plot [-h] [-t THRESHOLD] logfiles [logfiles ...]
and generate the plots again doing something like:
mp_plot -t 128 logfile1.log logfile2.log
or:
mp_plot -t 1024 *.log
etc.
Contact
Mailing list
- Subscribe by sending a message to memprof+subscribe@googlegroups.com
- Once subscribed, you can send emails to memprof@googlegroups.com
- List archives at http://groups.google.com/group/memprof
Copyright 2013-2015, Jose M. Dana